Software
HoloWorks*
Request Quote
HoloWorks 6 is released and will be distributed via Gatan and GMS 3.4.
Early adopters: HW6 is functional under GMS 3.3; contact us directly.
Reading: Some Remarks on the State of Electron Holography
General:
HoloWorks (HW) is the reference software for live holography at the microscope. It assists with microscope alignment, provides live phase computation/display that includes phase optimization and Fresnel fringe suppression. It also provides live phase unwrapping as well as live, color-coded magnetic contour lines. It supports data acquisition into so-called 3D data stacks that present many images but save as a single file. Its processing supports evaluation and interpretation of single or data stacks with emphasis on off-axis-type hologram processing and phase sensitivity down to and beyond the 2π/1000 level. It is fully integrated with Gatan’s GMS software.
HW further supports general data / Fourier processing and diffraction pattern analysis and enables an easy build of workflows by supporting chaining of image processing functions; i.e., output data of one live processing function serves as input for another live image processing function.
Because of the generally limited coherence of electron sources (electrons being Fermions), HW is specialized in acquisition and processing of data stacks, i.e., collection of images in one file. Using a time series of holograms (or conventional images) over a single, long exposure allows correction of both sample drift and interference fringe drift even when moving in disjunct directions.
HoloWorks tracks information on its data processing as part of the resulting image(s) to assure data reproducibility; a feature increasingly required by scientific journals.
As of 2018,
support for GMS v2 and GMS v3 is restructured; this is a necessary step due to the continuous evolution of Gatan's GMS features and user interface (UI).
GMS v2 users: click to this web page.
HoloWorks v5.1.2 <as of 08/2019 >
This version is released and distributed with GMS v3.4.
HW v5.1.2 updates v5.1.1 and, as its predecessor, drops most of the earlier power-of-two requirements.
Note for example, HW's specific processing assures scaling in Fourier space remains the same in x- and y- directions while representing all source data in Fourier space (not just the data in the largest square area of the image (or ROI) as GMS's default FFT does).
GMS v3 / HW v5 users: click to this web page.
HoloWorks v6*
Release: HoloWorks v6 requires and is distributed via GMS v3.4.
HW v6 computes live phase images from live holograms, removes Fresnel fringes automatically and allows live phase unwrapping. Its image stack acquisition and automated stack processing (including sample and interference-fringe drift correction) enables phase imaging at the 2pi/1000 phase sensitivity level - at the microscope due to its parallel processing features.
• The user interface of HW v6 is structured as workflow with increased (semi-) automation.
• C++ and Parallel Processing provide phase images at >10fps. ≫6 cores recommended.
• Processing 50 holograms and 50 reference holograms of size 3,710×3,838 pixels:
On a laptop using one i9-8950HK CPU, a fully reconstructed, Fresnel filtered, drift corrected
and averaged complex image is obtained in ≤ 100s. (data: 2018)
• As of late 2018, a 'cumulative electric charge profile' feature - has been added.
The profile can be taken in any direction updating live on live phase images.
*Note: HoloWorks does not stand on its own; it is a plug-in, or 'module' and requires the Gatan Microscopy Suite (GMS) Software, formerly known as DigitalMicrograph®. Contact HoloWerk@mac.com for additional inquiries like special projects or HoloWorks@gatan.com for bug fixes.
HoloWorks v6: (video) tutorials : Continuously updated
- HoloWorks UI
- LIVE (alt: on YouTube)
- Stack Acquisition + Processing (alt: on YouTube)
- Acquiring hologram stacks and reference stacks
- Stack analysis: how good is my hologram stack?
- Reconstructing stacks
- Averaging stacks: transparent biprism-drift and sample-drift compensation
- Sample-drift determination with high accuracy
- ... Averaging: when the fringe contrast is low and the field of view is wide (cont. from 2.d./e.)
- Unwrap: single images, ROIs or stacks
- Assuring a flat vacuum: linear wedge removal
- Utilities (alt: on YouTube)
- Technical comments
0. HoloWorks UI
Live - at the microscope
The first two buttons assist in setting up the microscope for holography.
Consecutive buttons support live holography data processing:
Sampling: Indicates all frequencies with a common sampling rate on live FFT
Contrast+: Continuously plots fringe contrast, drift and hologram quality Q
Live: Phase imaging (at >10fps) & Fresnel-fringe suppression
Unwrap: Unwraps live into new image (>4fps)
[rad]->[nm]: Calibrates intensity of phase image to thickness (live)
Induction: Computes magnetic contour-line image from phase image (>3fps)
VCR: Just like a VCR: copies live images into a (3D-) stack
+ Setup and info buttons
Stack Acquisition + Processing
Capture: Acquires images directly from camera into 3D data stack
+ref-wave: Reconstructs hologram/ref-hologram stacks for ~2π/1000
Average: Averages 3D-stacks of both, type complex or real
Cs corr: Aberration compensation for focus, astigmatism and Cs
Contrast+: Plots fringe contrast, drift and quality Q from stack
Drift/slice: Plots sample drift from stack via specific filters
Unwrap: Unwraps a single or stack of phase images
Tilt: Compensates for a linear tilt in 2D images or 3D stacks
+ Setup and info buttons:
Utilities
Sub-area: Creates new image from 1D, 2D or 3D data ROI
FFT: FFT - but from all of the selected area
Diffract: Apodization followed by FFT; minimize streaking
Peak: Provides amplitude, sampling rate and phase of selected peak
Complex to: Converts complex images multiple ways
Mean±Std.: Provides mean, standard and normalized-std values from ROI
Center ROI: Centers a ROI around pixel with highest value
+ Setup and info buttons:
SlicePlayer Courtesy of Gatan: HW 6 also contains the SlicePlayer
1. LIVE
1.a. Adjusting the microscope (optimizing hologram quality)
Figure 1.a.: Demonstrating live fringe contrast, fringe drift and hologram quality - tracking at ~15fps. The sampling rate is shown in the upper left corner of the line plot (here 2.69). Live holograms are typically used in a qualitative mode using binning and sampling rates close to the Nyquist limit for maximizing the field of view. Use the condenser setting and/or gun settings to optimize hologram quality:
! maximize Q !
(65MB, 1080p HD video. Select 'full view' for best viewing.)
1.b. Live Phase Imaging at ~10fps and beyond
Figure 1.b.: Live phase imaging uses special algorithms for minimizing artificial phase-jumps and reducing the appearance of Fresnel fringes.
In parallel, the interference fringes continue to be evaluated (continuation from Fig. 1.a.) Reconstruction rates on a Core i9 laptop for 512 x 512 holograms resulting in 512 x 512 phase images are ~10fps.
(60MB, 1080p HD video. Select 'full view' for best viewing.)
1.c. ... overriding auto features (of 1.b.)
Figure 1.c.: Live processing can be paused. Useful to manually select and override the auto-reconstruction parameters.
First, we demonstrate the effectivity of Fresnel fringe suppression.
Second, we show the manual selection of parameters.
To limit the size of the video, we work with a static image (at the microscope, keep the live acquisition running - just use the pause button to halt the reconstruction temporarily). (60MB, 1080p HD video. Select 'full view' for best viewing.)
1.d. Live Phase unwrapping
Figure 1.d.: Samples that create strong phase components, i.e., >>2π need phase unwrapping for further processing. This is specifically true for larger magnetic samples or electric charges as shown here, courtesy of S. Chung. But it can be easy.
(43MB, 1080p HD video. Select 'full view' for best viewing.)
1.e. Live magnetic contour lines
Figure 1.e.: Magnetic squares courtesy of A. Ponce. Magnetic induction and magnetic contour lines are computed live from hologram after reconstruction and phase unwrapping. The speed is live recorded and not accelerated - thanks to parallel processing capabilities of HW v6.
(40MB, 1080p HD video. Select 'full view' for best viewing.)
1.f. VCR: recording into stacks
Figure 1.f.: The VCR records live images (including RGB images from live magnetic contour lines) into a 3D data stack. As a courtesy of Gatan, HW v6 will be distributed with the Slice Player, allowing to save such data stacks as AVI file, ready to share with anyone.
(55MB, 1080p HD video. Select 'full view' for best viewing.)
2. Stack Acquisition + Processing
2.a. Acquiring hologram stacks and reference stacks
Figure 2.a.: The acquisition of a stack of images is easy. Click the button, enter the desired number of images and press the 'Acquire stack' button. The acquisition starts and provides feedback on its progress. This is a 11MB, Widescreen, 1080p HD video.
2.b. Stack analysis: how good is my hologram stack?
Figure 2.b.: With as many as several hundreds of images in a stack it is a good idea to check on the quality of the holograms in the stack. This is one of the few functions that require a square, power-of-two ROI selection. It just takes seconds. If a bad one is located, use the sub-area button described below. This is a 8MB, Widescreen, 1080p HD video.
2.c. Reconstructing stacks
Figure 2.c.: On clicking the stack reconstruction button HW reconstructs the displayed slices of each stack. The slices can be chosen at will and instantly display the reconstructed wave. As in 'Live,' the reconstruction parameters can be chosen freely albeit with a bit more freedom on the filters. With the parameters set, the reference stack is processed delivering the averaged complex image from the reference hologram stack. Then the hologram stack is processed to which the averaged complex image from the reference stack is applied.
This is a 31MB, Widescreen, 1080p HD video.
This is a 31MB, Widescreen, 1080p HD video.
2.d. Averaging stacks: transparent biprism-drift and sample-drift compensation
Figure 2.d.: Routine averaging of a complex, 16 slice 3D data stack yields a S/N ratio improvement close to 4. Specimen drift and phase offset corrections are automated and transparent to the user. When selecting the option to show the aligned stack, the alignment can be easily verified. If it needs improvement follow the instructions in 2.e. Data courtesy S. Chung. This is a 9MB, Widescreen, 1080p HD video.
2.e. Sample-drift determination with high accuracy
Figure 2.e.: Plot sample drift from a data stack or an ROI. Works for image data stacks in general. For hologram data stacks additionally, the Fresnel fringes can be removed. Important: the interactive setup allows to fine-tune the Fresnel fringe removal. This is a 12MB, Widescreen, 1080p HD video.
2.f. Averaging: when the fringe contrast is low and the field of view is wide
Figure 2.f.: Here we demonstrate averaging of a complex, 30 slice 3D data stack. Specimen drift has already been determined from the hologram stack itself and is available as line plot (see 2.e.). The pixel count in the holograms was 500 on average and fringe contrast was a meager 8%. Typical values should be around 20%. Due to averaging, excellent data can be obtained even under such circumstances. In this case a phase resolution of > 2π/300 is obtained in the vacuum area. Averaging allows better S/N or large-field of view phase images. This is a 23MB, Widescreen, 1080p HD video.
2.g. Unwrap: single images, ROIs or stacks
Figure 2.g.: High-speed single phase-images or phase-image stacks is just a click on a button. Courtesy of B. Frost. This is a 1MB, Widescreen, 1080p HD video.
2.h. Assuring a flat vacuum: linear wedge removal
Figure 2.h.: Non-flat vacuum or missing reference hologram? This feature removes a linear wedge from the image. The reference area can be selected to determine the wedge automatically and apply the found wedge to the full image. It is interactive and allows manual fine-tuning while observing line plots to assure accurate flatness. This wedge removal tool can also help with non-holographic images. This is a 5MB, Widescreen, 1080p HD video.
3. Utilities
3.a. Sub-area
Figure 3.a.: Isolating a sub-area from an image can cut out unwanted details. Even better, when holding down the Shift key when clicking the sub-area button allows refining the ROI area by moving and/or resizing the selected area live. Further, this can be done on a live image. To make things even better: for 3D data stacks the slices can be changed live. Also, a selection of slices can be extracted from a 3D dataset - just like selecting pages when printing. This is a 6MB, Widescreen, 1080p HD video.
3.b. FFT
Figure 3.b.: Both FFT and Live FFT are a key element of high resolution imaging. This FFT computes from all the pixels within the ROI and allows resizing of the ROI while maintaining identical scaling in both directions in the FFT. Check it out! This is a 25MB, Widescreen, 1080p HD video.
3.c. Peak analysis
Figure 3.c.: Peak analysis is simplified by reading peak coordinates as real-space coordinates. Multiple peaks can be flagged permanently.
If the FFT is live, the selected peak data are updated live. A very special feature: if the ROI in the source image is resized, the FFT resizes and the peak remains recognized. Very useful for, e.g., nano-crystalline materials. This is a 9MB, Widescreen, 1080p HD video.
3.d. Complex to Real
Figure 3.d.: Converting complex images to type real is easy and flexible. Activating the button creates a wide choice of features, like live conversion that updates the output when the source image or its ROI changes. Also, conversions can be run simultaneously. In this example we move an ROI and resize the ROI within the complex image and observe the output files. This is a 6MB, Widescreen, 1080p HD video.
3.e. Mean and standard deviation for ROIs, live
Figure 3.e.: Mean and standard deviation (σ) values are an important measure for image quality. For holography there is a vital distinction on how to measure noise in phase versus amplitude images. For amplitude images, we recommend using the normalized value of σ whereas for the phase image we recommend the conventional expression for σ as it typically refers to 2π. Not shown here: when calling the button with the Shift key pressed, the values will be shown in a line plot as HoloWorks assumes the source image is a live image. This is a 7MB, Widescreen, 1080p HD video.
3.f. Center ROI around maximum

Figure 3.f.: Center a given ROI around the maximum within that ROI with: 'Center ROI'. Used for, e.g., centering the sideband manually.
4. Technical comments
HoloWorks Version v6
This version has been released as of M&M 2018 and will be distributed with GMS v3.4. shortly.
HW v6 is a complete redesign focused on daily and generic use of the software.
The data shown were recorded with Camtasia Studio and have not been accelerated; They reflect the true performance of a 6-core laptop. We expect significantly faster performance on high-end desktop systems.
Recommendations are a minimum of a 6-core system and a fast graphic card to take advantage of the speed improvements through parallel processing. Even without parallel processing, speed improvement is still significant as scripting functions have been moved to C++.
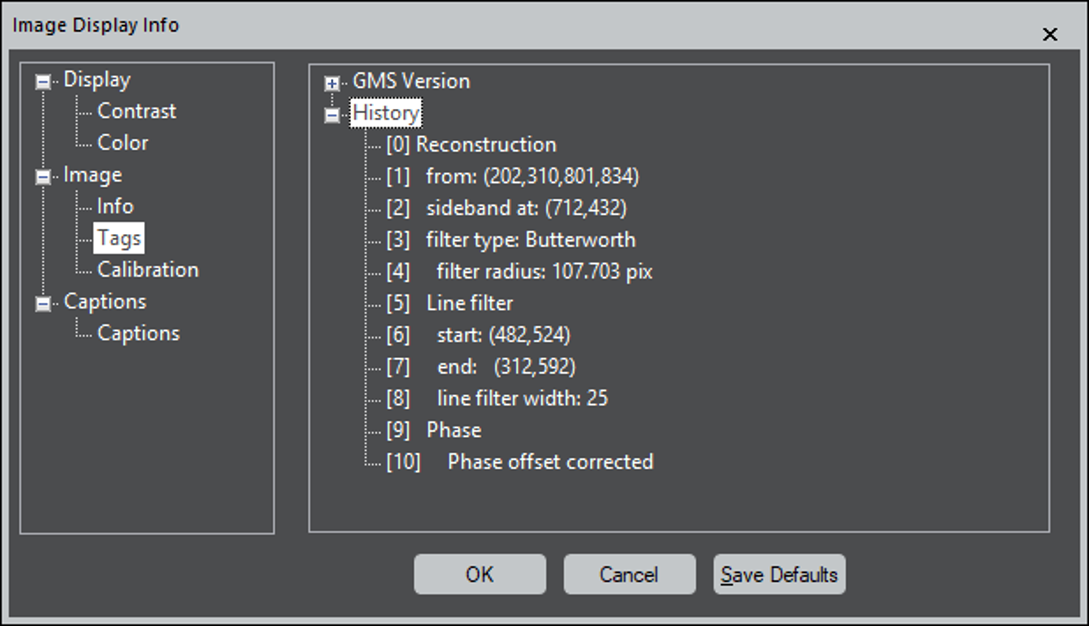
Data Processing: keeping track
HoloWerk is proud of keeping track of its data processing.
Here is an example how data processing details for reconstructing a reconstructed hologram are stored with the image: